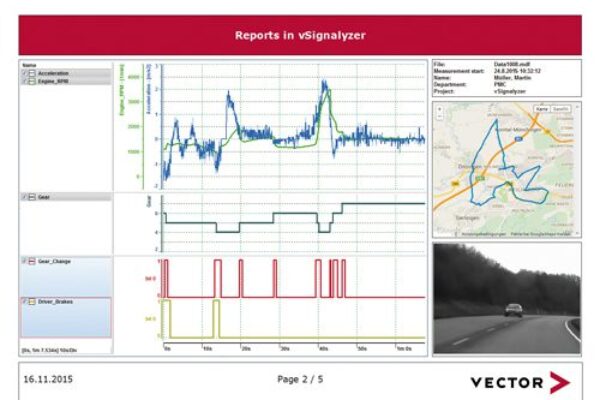
Software visualises, analyses and documents measurement data
vSignalyzer enables time-synchronous display of measurement signals, bus traces, GPS data and video or audio signals. New features of Version 14.0 include signal-oriented offline analysis of Ethernet log files (BLF, PCAP, ARXML) via extended database support.
The new version eases the evaluation of large data archives as well as searching them. Complex evaluation functions and data mining calculations can be started with just a few mouse clicks, and they run fully automatically. Specific data mining results from different measurement files can be documented in a single PDF document. The configurable print view offers a WYSIWYG interface to ensure predictable documentation format and content. Drag-and-drop functions make it a snap to copy data views to office programs like Word, PowerPoint, or email, which accelerates the documentation of analysis results.
vSignalyzer comes complete with file converters for importing/exporting measurement data in all common file formats – including MDF, BLF, XLX, ASC, and CSV. Version 14.0 also supports GPS data in NMEA-0183 standard format.
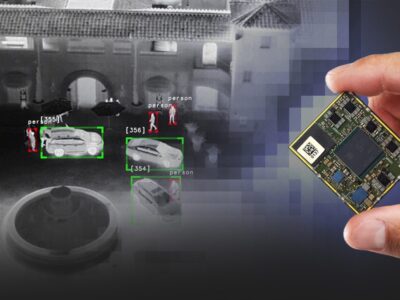
Measurement data from driver assistance systems (ADAS) can be displayed in video windows or on GPS maps with object overlays. Extended visualization options for roadway curves, markings and sensor zones make it easy for ADAS developers to verify object recognition algorithms for a wide variety of (multi-) sensor systems.
For more information visit www.vector.com/vsignalyzer
 If you enjoyed this article, you will like the following ones: don't miss them by subscribing to :